Quality
CUSUM and EWMA: catching small, sustained shifts
Follow how CUSUM and EWMA accumulate small process shifts, work through a six-point example, and choose their parameters with false alarms in mind.
 KutupASP Dijital
Control limits are calculated from the process's own variation and show whether it is stable. Specification limits come from design or the customer and show whether the output is acceptable. The two are independent: a process can be in control and still out of specification, or the reverse.
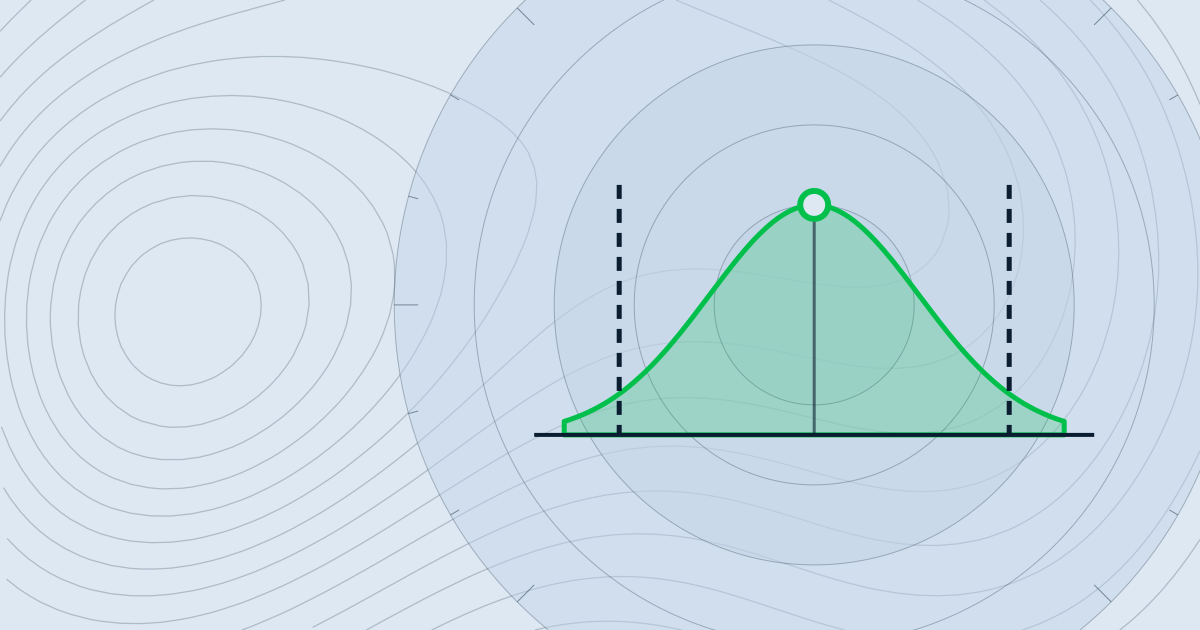
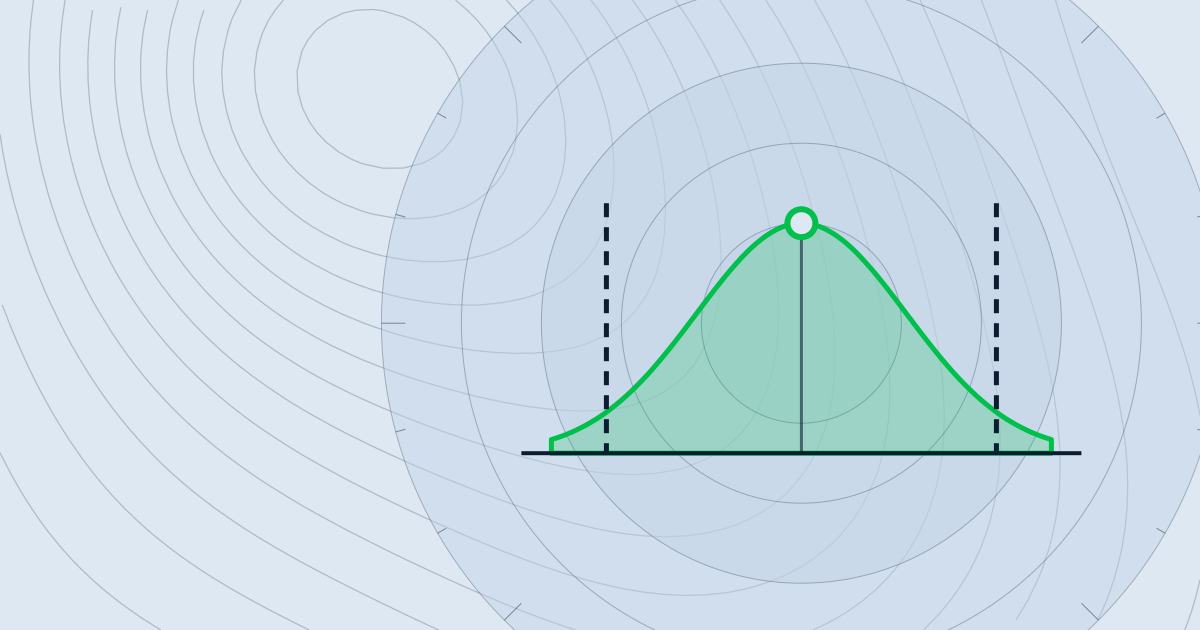
Control limits sit one on each side of the centre line of a control chart, three standard deviations of the plotted statistic away. For an X-bar chart that statistic is the subgroup mean, so the limits depend on subgroup size. They come from the process itself, and a point beyond them signals that something changed the process.
Specification limits, the LSL and USL, come from the drawing, the function of the part or the customer requirement. A part outside them does not meet the requirement, whatever the chart shows.
Because they come from different sources, neither can replace the other. Drawing specification limits on a control chart mixes two questions and obscures the signal the chart is meant to give.
Hypothetical example: specification 9.8 to 10.2 mm. Each subgroup has n = 9 measurements, the centre line is 10.00 mm, and the within-subgroup standard deviation is σ = 0.15 mm.
While the points stay between 9.85 and 10.15 mm, the chart gives no signal. It does not look at individual parts, though, and those can fall outside 9.8 to 10.2 mm. With Cp = 0.4 / (6 × 0.15) ≈ 0.44, this process is stable but does not meet the specification with enough margin.
The most common mistake is drawing specification limits on an X-bar chart. The chart shows subgroup means, which spread less than individual parts, so means can sit inside tolerance while many parts fall outside it. A second mistake is reading 'inside the control limits' as 'conforming'. A third is setting control limits by hand, from a fixed band or a target, instead of calculating them from stable data.
Not necessarily. Being inside specification on one day says little about the next. Capability is a separate question. It needs a stable process, enough data and an index such as Cp or Cpk computed from that stable period.
After a real change in process variation, such as maintenance, new material, new equipment or an improvement project. Do not recalculate them whenever a few points move. Choose a stable reference period and record every change made to it.
Example numbers are hypothetical, not measured field results.
Follow how CUSUM and EWMA accumulate small process shifts, work through a six-point example, and choose their parameters with false alarms in mind.
Work through Cp and Cpk on a hypothetical example, see how centring changes the result, and learn the conditions that must hold before the indices can be interpreted.
Control charts have watched process drift for decades. Before proposing a machine learning model, look at what this simple method says.