Reliability
Remaining useful life (RUL): report an interval, not one number
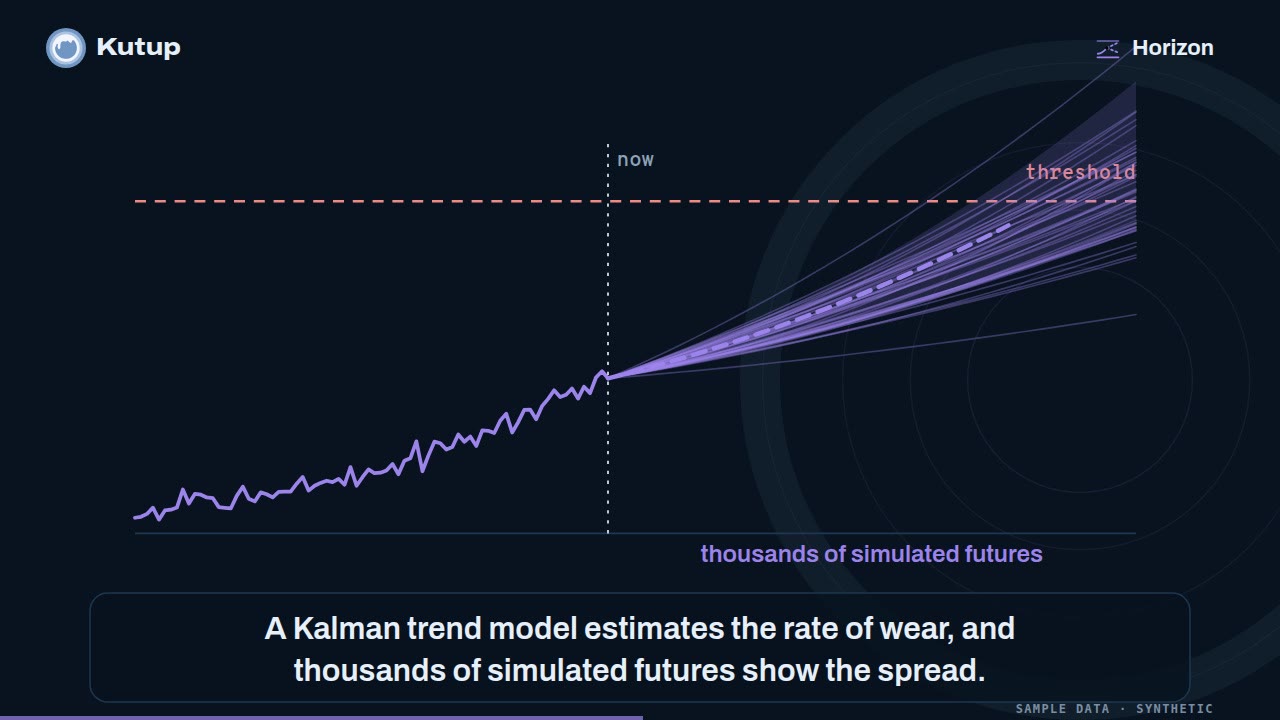
Learn how RUL is defined, what each of three common approaches needs as data, and how to report P10, P50 and P90 values with a worked trend calculation.
 KutupASP Dijital
Sourced answers, inspectable data, testable methods.
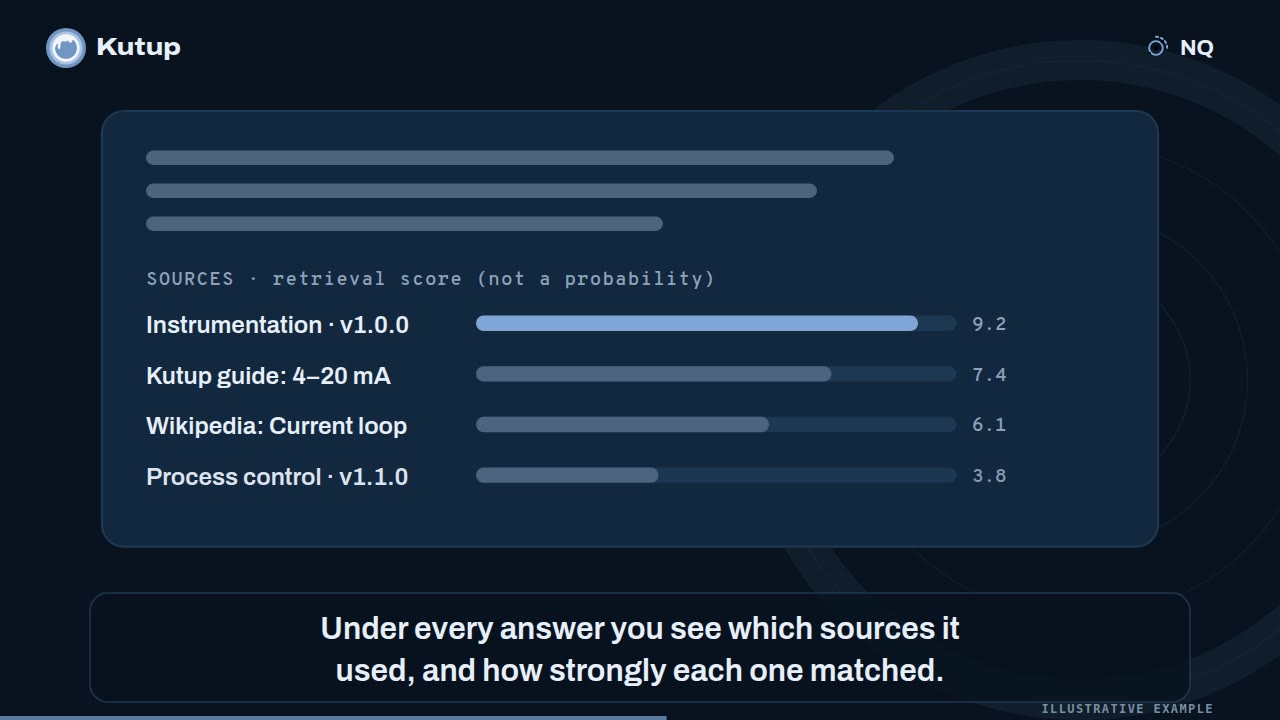
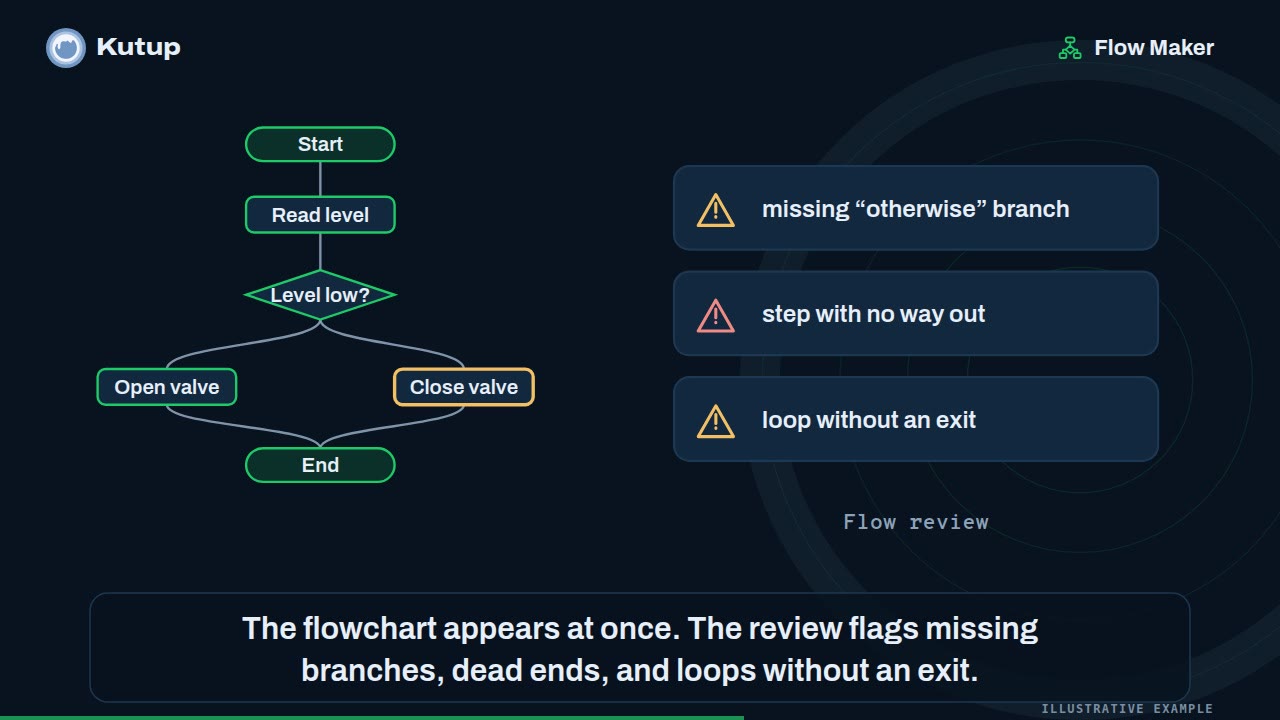
Short narrated tours: what each tool does, how to read its result and where to start.
Learn how RUL is defined, what each of three common approaches needs as data, and how to report P10, P50 and P90 values with a worked trend calculation.
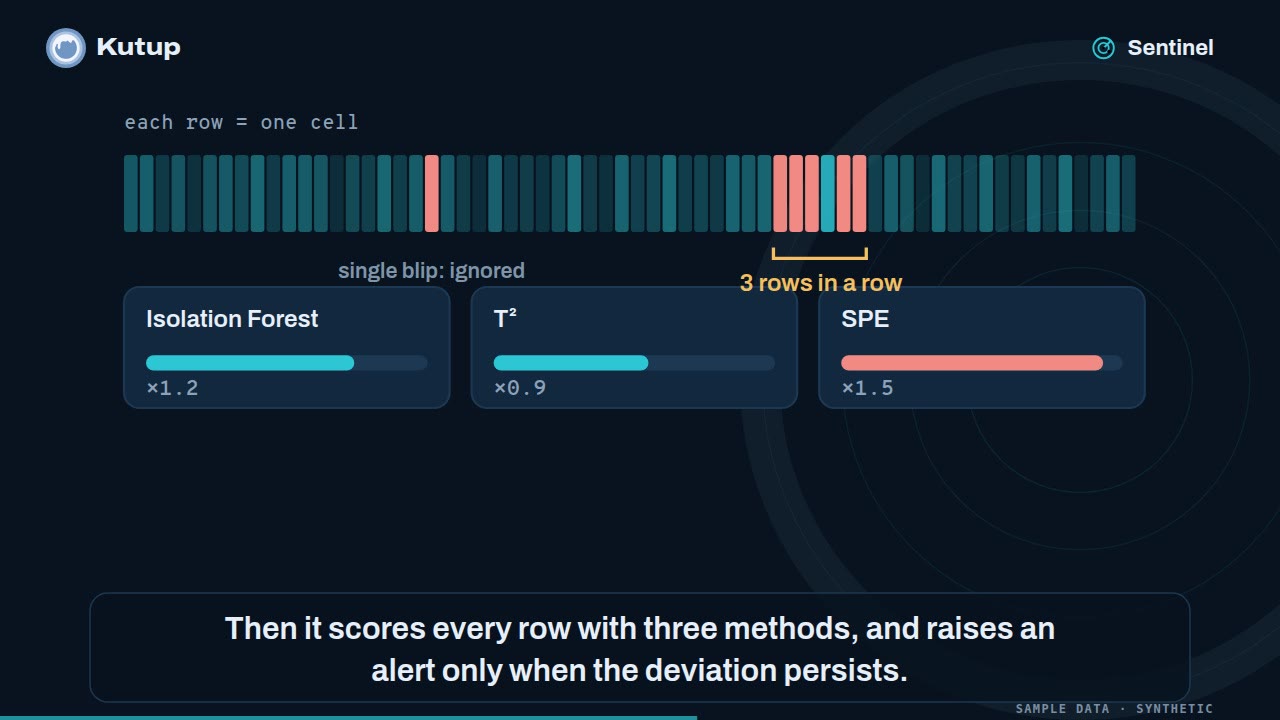
Read flagged rows in a sensor table by their isolation score, understand what contamination does in the model, and see where the method misleads you.
Read correlated sensors through T² and SPE together rather than one statistic, interpret contribution plots, and learn where the method’s assumptions break.
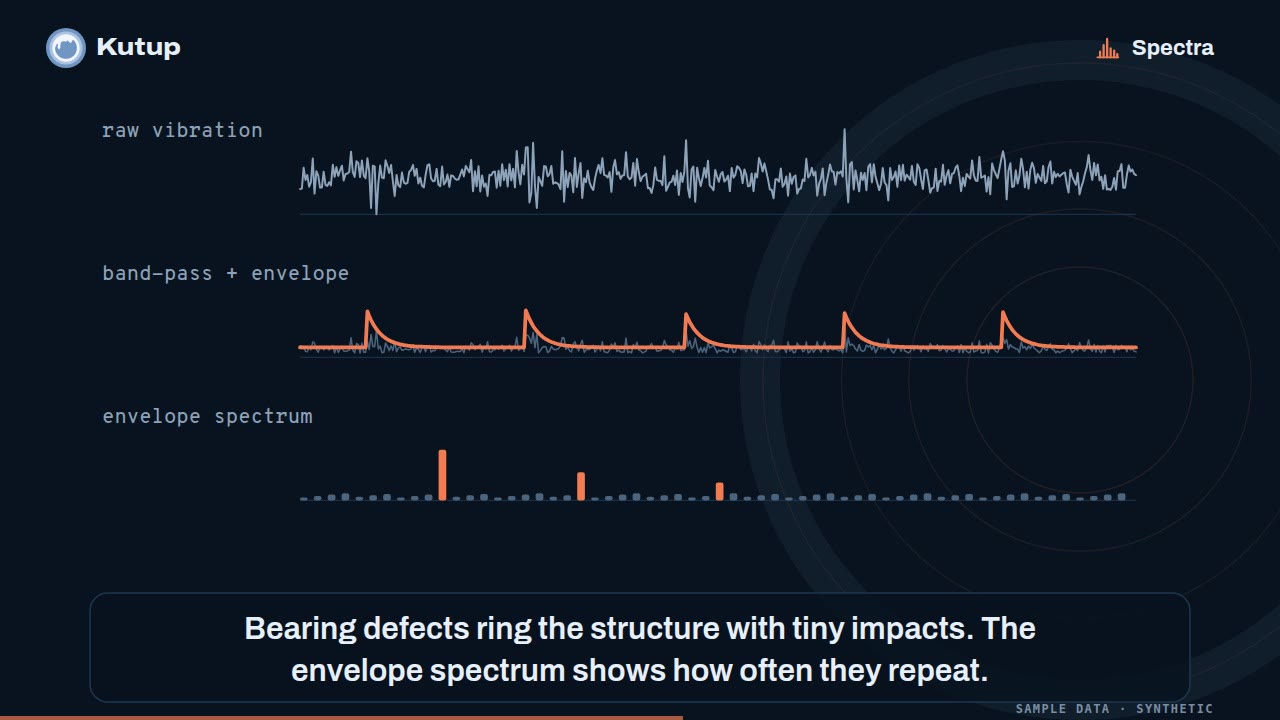
After reading, you can compute frequency resolution for a vibration record, justify your window choice, and read spectral peaks as clues rather than diagnoses, using a worked example.
Units, source, version. Synthetic kept apart from field data.
Simple baselines, local computation, inspectable retrieval.
Held-out data, measurable acceptance, an engineer’s decision.

Let’s review your data source, your existing system and the decision you want to improve.