1
Learns normal
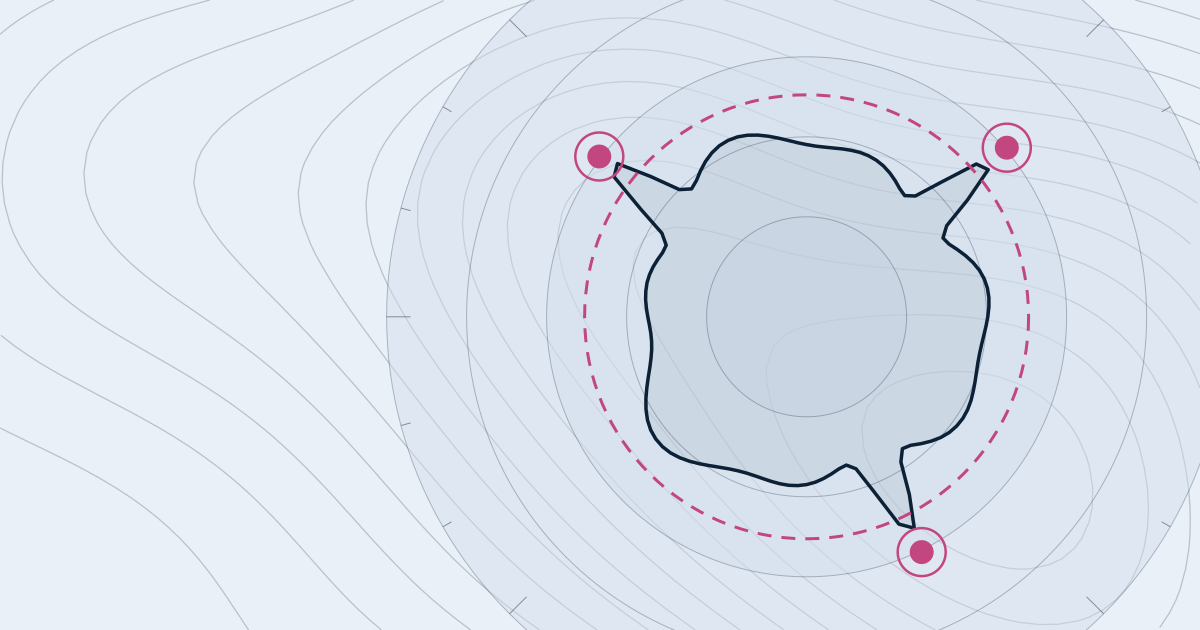
Sentinel studies the first part you call “normal”: how the sensors move together.
 KutupASP Dijital
Load your sensor table. Sentinel learns normal operation, flags unusual periods and shows which sensors carry the deviation. Your data stays in this browser.
A short narrated tour: how normal operation is learned, how to read an alert and where to start.
A machine has dozens of sensors. A failing seal rarely breaks one limit. It quietly changes how the sensors move together. Sentinel learns normal operation from the first part of your data. Then it scores every row with three methods, and raises an alert only when the deviation persists. For each alert you see which sensors carried the deviation, so you know where to look first. Load a CSV, or try a built-in scenario. Everything runs in your browser.
Narration: synthetic voice (Piper, voice “Joe”, CC0 public domain). Captions are burned into the video.
Sentinel studies the first part you call “normal”: how the sensors move together.
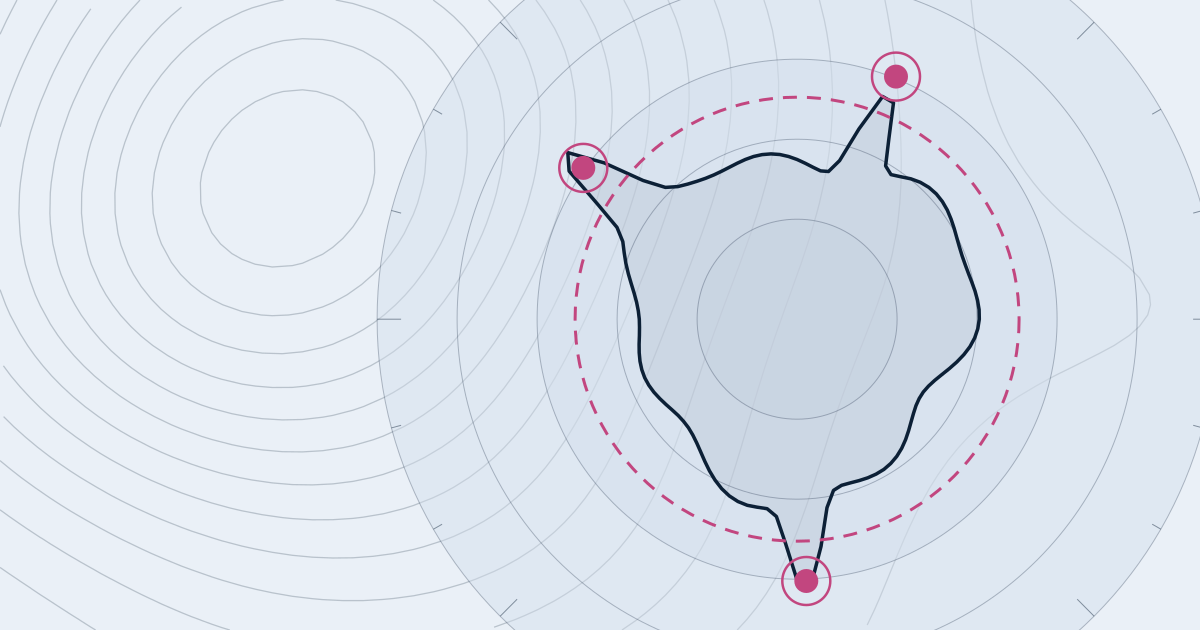
Three methods measure how far each row sits from normal. A combined deviation index above 1 means a limit was crossed.
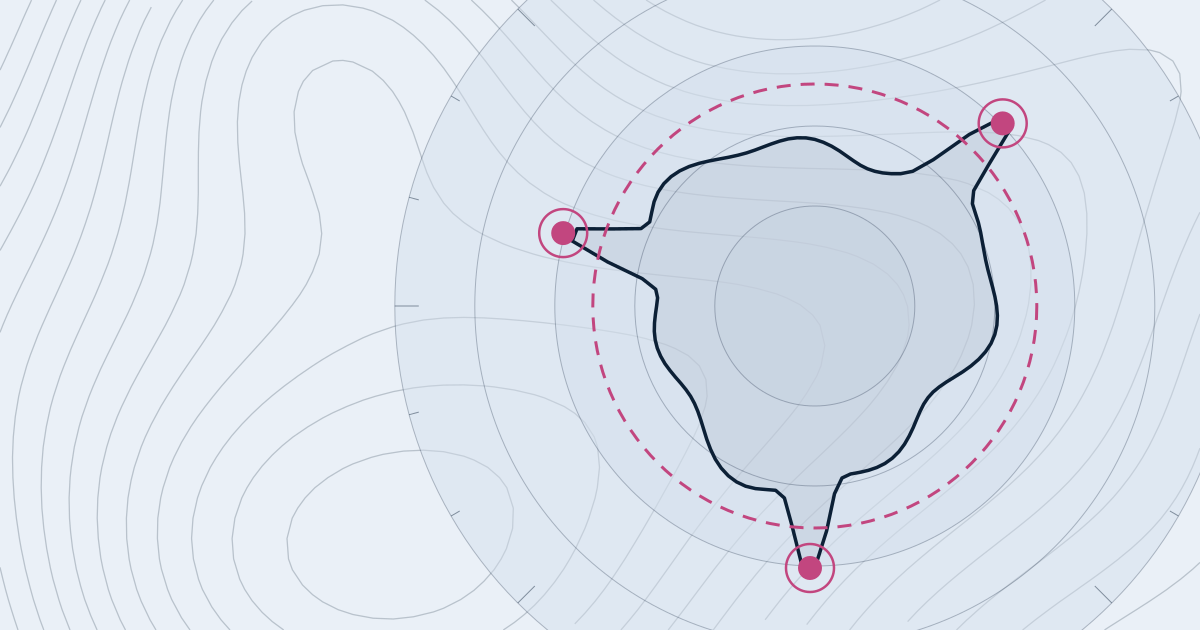
For each unusual period you see which sensors contributed most. The decision stays with you.
Pick a scenario. All are mathematically generated examples, not real plant data.
Drop a CSV file here
Numeric columns are sensors; a date column becomes the time axis.
When the line crosses 1 a limit is exceeded. Hover to read; drag to zoom. (Values are clipped at 4; true peaks are in the period list.)
Pick one to see the reasons below.
Bars show how the deviation is shared between sensors. Small charts compare each sensor with its own normal band.
Each point is a row. Horizontal: size within the normal relationships; vertical: how far those relationships broke; both relative to their own limit (1). Outside the box means a limit is crossed. Faint points are the training part.
Rows and periods where several sensors together depart from the learned normal operation. It also catches cases where each sensor is within its own limits but the combination is unusual.
No. Sentinel only says a row departs from the normal it learned. A commissioning step, a product change or maintenance also look unusual. The engineer decides the cause; the per-sensor shares for each period support that review.
No. The table is processed in your browser by a WebAssembly module written in C. Nothing is sent anywhere and it is gone when you close the page. Files you export stay with you.
The model then treats that behaviour as normal and may miss similar events later. Check that the training part really represents normal operation; Sentinel also shows the alarm rate inside the training part.
In practice at least a few hundred normal rows and two to twenty-four numeric sensors. Sentinel reads up to 20,000 rows; model training uses up to 4,096 rows, selected at even spacing.
Read flagged rows in a sensor table by their isolation score, understand what contamination does in the model, and see where the method misleads you.
Read correlated sensors through T² and SPE together rather than one statistic, interpret contribution plots, and learn where the method’s assumptions break.
Learn what unlabelled sensor history can and cannot tell you, how to evaluate a detector without labels, and why operating modes need attention first.

Let’s review your data source, your existing system and the decision you want to improve.