ML
Isolation Forest for sensor anomalies: how it works and where it misleads
Read flagged rows in a sensor table by their isolation score, understand what contamination does in the model, and see where the method misleads you.
 KutupASP Dijital
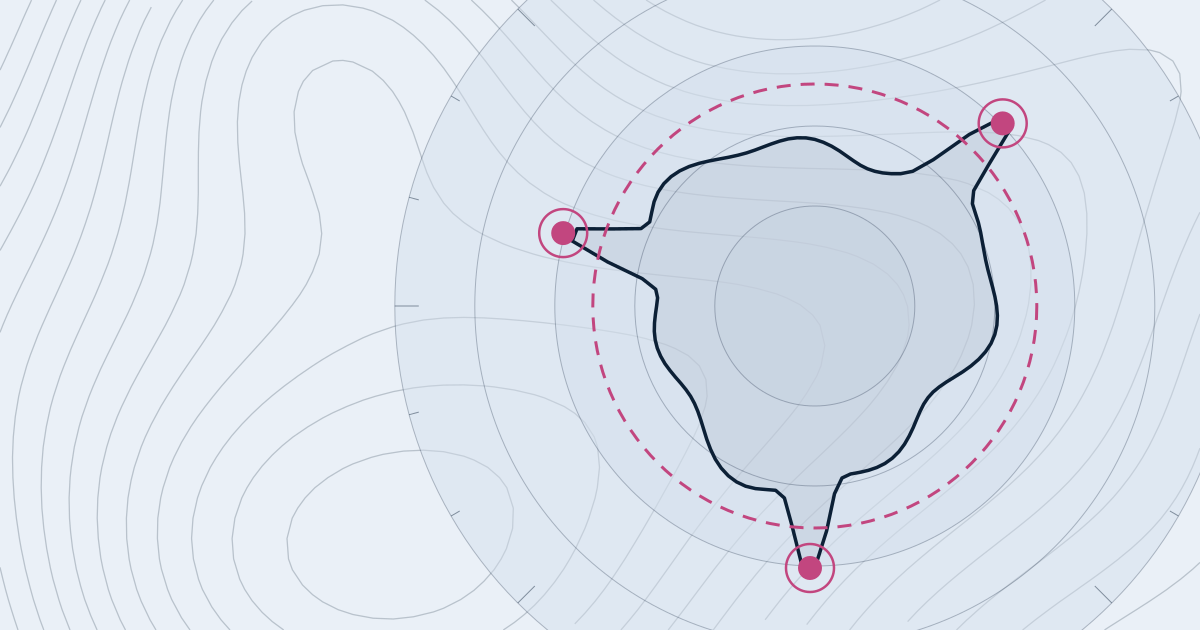
Isolation Forest uses random trees that split data along single features at random cuts. Rare, unusual points are isolated after fewer splits, giving them a score near 1. Typical points score near 0.5, meaning no clear distinction. The method needs no distance measure or scaling.
The method splits a table by picking a random feature and a random cut value within its range, then repeats this on each side. Each tree keeps splitting until every point sits alone or a depth limit is reached. Dense normal data needs many cuts to separate one point from its neighbours. Rare, unusual points end up alone after few cuts.
Each tree is grown on a small random subsample of the training data, with 256 points as the common default. For a point x, the average path length E[h(x)] across trees is computed. The score is s(x) = 2^(−E[h(x)]/c(n)), where c(n) is the average path length of an unsuccessful search in a binary search tree with n points. Here n is the subsample size used to build the trees, so with 256 it is about 10.25.
Suppose a pump has five sensors: vibration, bearing temperature, flow, pressure and motor current. Training uses 4 000 normal rows. After a seal change, six rows are flagged.
Assume the six flagged rows average a path length of 4.0 across the trees. With n = 256, c(256) ≈ 10.25, so the score is 2^(−4.0/10.25) ≈ 0.76. A typical normal row sits near the average path length, so its score is about 0.50. The six rows therefore stand clearly apart from the normal rows.
If contamination is set to 0.002, the cut-off is placed so that about 0.2 % of training rows, which is 8 of the 4 000, fall beyond it. That value is a setting chosen by the engineer. It does not measure how often the pump actually fails.
The method does not know about time. It treats rows as independent, so six consecutive flags carry no order information. Regime changes and drift require refitting on recent known-normal data. Points that look normal in each variable on its own, yet are wrong in combination, can be hard to isolate.
Common mistakes include reading contamination as the true fault rate, training on a window that mixes two operating regimes such as before and after a maintenance change, and assuming a flag names the cause. To explain a flag, check which sensors deviate most from their median, or which needed the fewest cuts to isolate the point.
No. It is an unsupervised method, trained on history assumed to be normal. If that history contains unrecorded fault periods, the model will treat them as normal, so check the training window against maintenance records and operator knowledge before fitting.
No. Each split uses one feature at a time, so sensors with different units do not need standardising. The trade-off is that the method does not model how variables relate to each other. For correlation-based faults, methods such as Hotelling T2 and SPE address that structure directly.
Example numbers are hypothetical, not measured field results.
Read flagged rows in a sensor table by their isolation score, understand what contamination does in the model, and see where the method misleads you.
Learn what unlabelled sensor history can and cannot tell you, how to evaluate a detector without labels, and why operating modes need attention first.